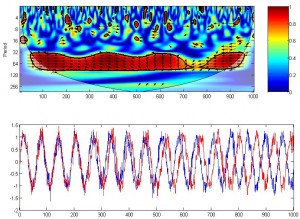
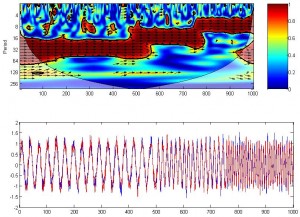
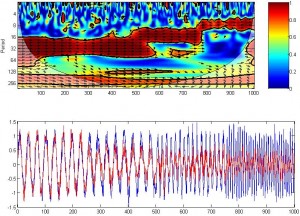
Wavelet transform coherence (WTC) is a method for analyzing the coherence and phase lag between two time series as a function of both time and frequency (Chang and Glover 2010). Here I played with it using the MatLab toolbox provided by Grinsted et al.
In the following examples, I created two time series, x (blue) and y (red) with different properties (phase shift, frequency and amplitude) and run wtc(x,y,’mcc’,0) command. Small white noise was added to the time series.
1. Phase shift and angle. A rightward arrow indicates 0 lag; a bottom-right arrow indicates a small lead of x; a leftward arrow indicates x and y is anti-correlated.

2. Frequency. At what frequency (or period) are x and y correlated?

3. Amplitude. It seems amplitude doesn’t matter much.

Toolbox can be found:http://www.pol.ac.uk/home/research/waveletcoherence/
Note: this link is dead. To download the “Cross Wavelet and Wavelet Coherence Toolbox”, please enter
https://www.alivelearn.net/?p=1561
MatLab source code:
t =[1:1000]/10;

%% effect of phase
x = sin(t) + randn(size(t))/5;
y = [sin(t(1:250)) sin(t(251:500)-pi/4) sin(t(501:750)-pi/2) sin(t(751:end)-pi)] + randn(size(t))/5;

figure('color','w');
subplot(2,1,1);
wtc(x,y,'mcc',0)
subplot(2,1,2);
plot(x);
hold on;
plot(y,'r')

%% effect of frequency
x = [sin(2*t(1:250)) sin(2*t(251:500)) sin(4*t(501:750)) sin(8*t(751:end))] + randn(size(t))/5;
y = [sin(2*t(1:250)) sin(2*t(251:500)) sin(4*t(501:750)) sin(8*t(751:end))] + randn(size(t))/5;

figure('color','w');
subplot(2,1,1);
wtc(x,y,'mcc',0)
subplot(2,1,2);
plot(x);
hold on;
plot(y,'r')

%% effect of amplitude
x = [sin(2*t(1:250)) sin(2*t(251:500)) sin(4*t(501:750)) sin(8*t(751:end))] + randn(size(t))/5;
y = [sin(2*t(1:250)) sin(2*t(251:500))/2 sin(4*t(501:750))/3 sin(8*t(751:end))/4] + randn(size(t))/5;

figure('color','w');
subplot(2,1,1);
wtc(x,y,'mcc',0)
subplot(2,1,2);
plot(x);
hold on;
plot(y,'r')


please help me about running wavelet coherence and cross wavelet programs
I have updated the toolbox, put it on github, and it is now hosted at: http://www.glaciology.net/wavelet-coherence
Dear Xu Cui,
Can we have wavelet coherence Matrix in Matlab?
Respected Sir,
I need an help from you.I have a doubt in wavelet coherence using matlab.i have two series of length 80.how should i write the code in matlab so that i will get the wavelet coherence of two time series is a single value?
HOW I UPDATED THE WAVELET TOOL BOX FOR PERFORMING THE CROSSWAVELET AND WAVELET COHERENCE
Your test is simulation experiment.How about truthful data
respected sir
I see that the arrows pointed up indicated the second series lag the first series 1/4 cycle on the site https://www.mathworks.com>examples
The ‘v6’ argument to COLORBAR is
deprecated, and will no longer be supported in a
future release.
@Liuxiaoyun
Thanks for the warning.
how do i solve the problem?
@Liiuxiaoyun
No need to solve for now. If future matlab does not support it, you might need to modify the source code.
Dr. Cui, many thanks for your great information,
How can I limit the period in y axis to 64 or 32?
How to compute cross wavelet or wavelet coherence for time series having same sampling rate but different lengths?
@pankaj jadhav
You will have to cut the longer series so their lengths are equal.
Respect Sir. I have some questions below and look forward to receive your answer:
1. [rsv,period] = wtc(x,y,’mcc’,0); In my experiment, x,y have a length of 90 seconds(sampling rate equals to 12). But the minimum frequency of 1/(period/sampling rate) I calculate is around 0.03Hz, instead of 1/90 Hz. Is the result wrong? Does this mean if i want to reach the minimum of 0.01Hz, I need a longer data(more than 90 seconds)?
2. [rsv,period] = wtc(x,y,’mcc’,0); The frequency sequence i got based on 1/(period/sampling rate) is not distributed uniformly. It’s not convenient to segment frequency range for further analysis. How to solve this problem?
why the number of surrogate data sets in the significance calculation is set to zero in your example?
I have a question. What is the meaning of axis y (period)? I don’t understand, why chose 4-128? Can you explain a little bit about this?
Please, can anyone help me with how to run multiple wavelet coherence? Especially, the codes.