Cohort analysis is a good metric on how users engage to an application. To do this, you:
- Break the users into cohorts according to when they register (bin size usually a month)
- Count the number of users in each cohort who login in over time
- Plot it
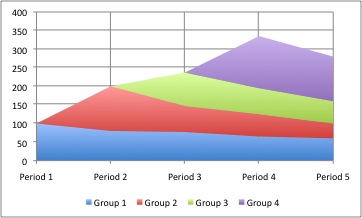
What you can get:
- the number of users currently using the program (read the height of period 5)
- retention rate over time
- growth rate
EverNote ECO Phil Libin used this analysis to attract investors.
Source: http://disruptivegrowth.wordpress.com/2010/07/12/running-the-numbers-cohorts/
How to make the cohort analysis plot?
It’s actually simple. Use Excel. Prepare a table where each row is one cohort over time, and each column is a time point. Then click “insert” and “Stacked Area”.


very clear explanation, thank you..