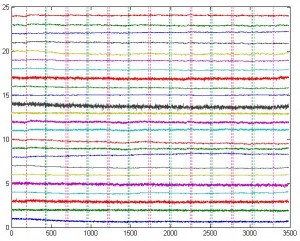
You often need to plot the time series of NIRS signal from all channels with event indicators (See the example below). plotTraces can do that easily.

In the above example, time series of all 24 channels are plotted. The number on the y-axis indicates the channel number, and the vertical lines indicate events. Each color represents one event.
Here is an example of using this function:
figure;plotTraces(hbo, 1:24, mark);
where hbo is Nxm matrix (N: # of time points; m: # of channels). mark is a nx2 matrix where the 1st column is event type (1, 2, 3, …) and the 2nd column is the timing of each event.
And here is the source code of the function.
plotTraces.m


Wow…
I like it. It is very meaningful.
Thanks.