Handy programs to visualize NIRS data (3): plotFFT

11 sec read

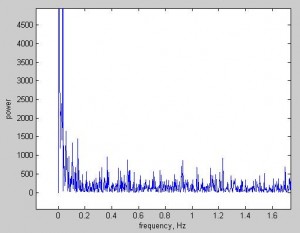
Sometimes you wish to know the spectrum of a time series. plotFFT is a handy function for this purpose.
plotFFT
plotFFT

You instantly know the power of the signal at each frequency.

Here is an example on how to use this function:

figure; plotFFT(randn(1,1000));

Source code:
plotFFT


写作助手,把中式英语变成专业英文


Want to receive new post notification? 有新文章通知我

第五十八期fNIRS Journal Club通知2024/12/07, 10am 王硕教授团队

理解噪音中的言语对老年听力损失患者来说是一个重大挑战。来自首都医科大学附属北京同仁医院耳鼻咽喉科研究所王硕教授团队的助理研究员王松建将为大家介绍他们采用同步EEG-fNIRS技术,从神经与血流动力学两
Wanling Zhu
10 sec read

第五十七期fNIRS Journal Club视频 王欣悦博士

Youtube: https://youtu.be/vyo-kECC2Ps 优酷:https://v.youku.com/v_show/id_XNjQzNTA0ODIwMA==.html 肢体语言——
Wanling Zhu
20 sec read

第五十七期fNIRS Journal Club通知2024/11/02, 10am 王欣悦博士

肢体语言——例如人际距离、眼神、手势等,如何影响我们的交流,是一个有趣的谜题。它们是优雅而神秘的代码,无本可依、无人知晓,却又无人不懂。来自南京师范大学的王欣悦博士将分享如何通过fNIRS超扫描技术,
Wanling Zhu
16 sec read

Leave a Reply

Your email address will not be published. Required fields are marked *