Description:
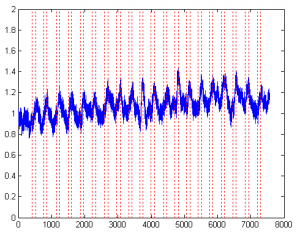
The subject is myself. I did a simple finger tapping task. I continuously tapped my right hand on the table for 10s, then rest for 20s. Then repeat this tapping-rest cycle for 20 times.
NIRS signals were recorded by Hitachi ETG-4000.
The data is very good: you can see the changes of HbO and HbR in the individual trials in motor cortex (channel 13 this case). See figure below:
(click to zoom)
The data is available for download (fill the form below). Here is the description:
1. This data file can be loaded in MatLab (using the load command).
2. After loading the data, there are 3 variables, hbo,hbr,marker. hbo is oxy-Hb data, hbr is deoxy-Hb data, and marker indicates the timing of the finger tapping event.
3. hbo and hbr are 7562×24 matrices. Each column is for a channel (and we totally have 24 channels), each row is for one time point. The sampling frequency is 10Hz.
4. mark is a 40×2 matrix. The first column can be ignored. The 2nd column is the timing of the onset and offset of finger tapping alternatingly.
To download the data, fill the following form and click Submit button. You will receive a download link shortly.


Dear Dr. Cui,
Thank you for your huge contribution on NIRS. DO you have any sample finger tapping data includes at elat one short channel?
Best
What is elat one short channel?
Hi Xu,
Do you happen to have the filtering/motion-artifact-removal information available?
Mainly:
– high-pass/low-pass frequencies for the band-pass filter.
– method used for motion-artifact-removal.
I’m trying to use the data, but not getting the correct response.
Thanks,
Nav
@N
Nav, please check out http://www.alivelearn.net/?s=noise+nirs to see if there are any info useful. The data provided here is fairly clean though.
@Xu Cui
Many thanks.
Nav
Hi Professor,
I am new at using ETG-4000 I have a small query that is ETG-4000 provides absolute HbO, HbR and HbT or change in concentration of HbO, HbR and HbT. I have read many papers they first download data from ETG-4000 and then apply MBLL in order to get a change in concentration of HbO, HbR and HbT. Waiting for your kind reply.
Thanks,
Nauman
@Nauman
I believe it’s relative.
thank you, Professor, so we don’t need to apply MBLL in order to get change and we can directly download the HBO, HbR and HbT for further analysis? is that right?
@Nauman
Correct. However, ETG4000 does offer you an option to download the raw light intensity data.
Thank you, professor, for your kind reply and help.
Hi profesor Xu Cui
I whish know if there is a paper related to this data. I would recopile data in my lab with my own equipment and then compared it with a stablish study to check if my prosessing analysis is correct. For that I am locking for a finger tapping protocol where it studies the activation in task period vs rest
@Agustin Humberto Rovira
Please check out: https://www.ncbi.nlm.nih.gov/pmc/articles/PMC2818571/
Hi Dr. Cui
Do you happen to have the differential pathlength factor (DPF) for your measurement? I want to convert the oxy and deoxy back to the optical density.