Before performing any data analysis, we should check the data quality first. Below are 3 ways to do so.
1. Visual check of the time series
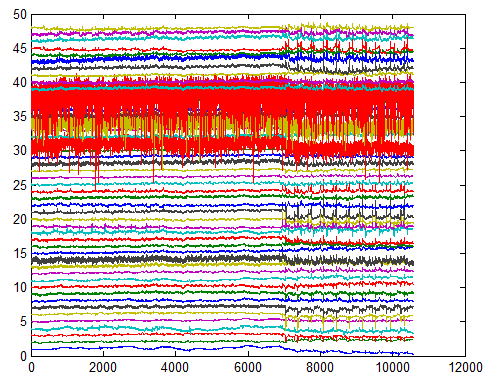
The best pattern detector is our eyes and brains! In many cases, if we visually see the data, we know what is wrong. You may use the method and program in this post to plot the time courses of all channels (not just one).

In the plot above, all 48 channels are plotted together (the y-axis). We can clearly see two types of noise:
- The spikes which occur in most channels after time point 7000. These spikes are caused by head motion.
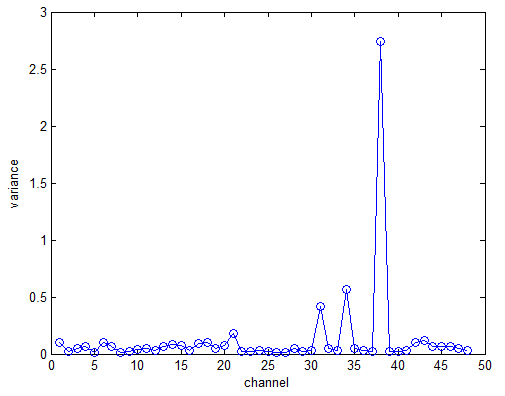
- The high noise level in the “red” channels (channels 39, 34, 31). This is more evident if we plot the variance of each channel (figure below). As we can easily see, the variance of channels 39, 34 and 31 is much higher than other channels.
2. Existence of the “heart-beat” band
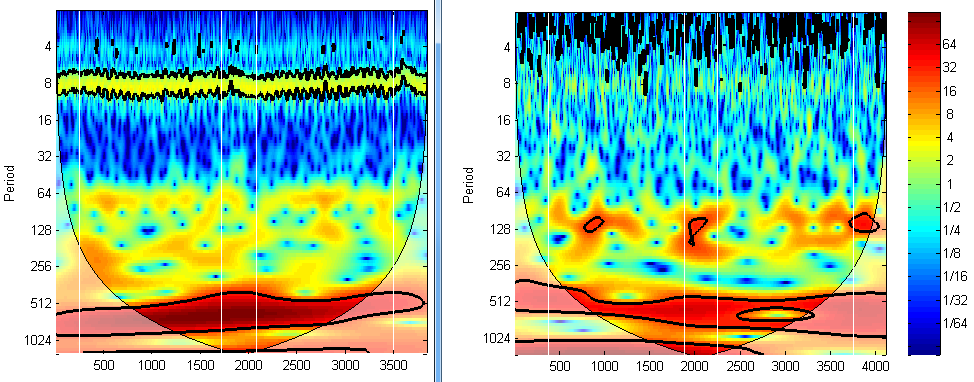
If the NIRS signal was acquired well, then the heart beating signal should be captured, leaving a bright brand in the frequency ~1Hz in the wavelet transform plot, just like the left plot in the figure below (the band close to period 8). If there is no such band, it does not necessarily mean the signal is trash, but you need to be cautious. To use the wavelet transform toolbox, please download here: https://www.alivelearn.net/?p=1561

Example:
figure;wt(hbo(:,1))
3. Correlation between hbo and hbr
The third way is to check the correlation between hbo and hbr. They are supposed to have negative correlation, at least in young healthy subjects. If not, or if they have perfect negative correlation (-1), then they might contain too much noise. We have a separate article on this method. Please check out https://www.alivelearn.net/?p=1767

Below is the scripts used for the 3 methods.
[hbo,hbr,mark]=readHitachData('SA06_MES_Probe1.csv');

figure;plotTraces(hbr,1:52,mark)

figure;wt(hbo(:,1))

for ii=1:52; wt(hbo(:,ii)); pause; end

[badchannels] = checkDataQuality(hbo,hbr);
Do you have other ways to check data quality? Please let me know!


