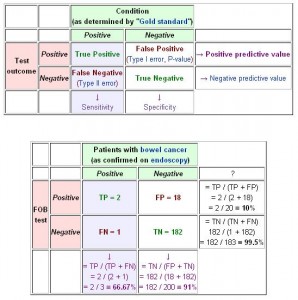
You can’t believe how much jargon there is in binary classification. Just remember the following diagram (from wiki).

accuracy = ( TP + TN ) / (P+N), i.e. correctly classified divided by the total
false discovery rate (FDR) = TP / (TP+FP), i.e. correctly classified as positive, divided by all cases classified as positive
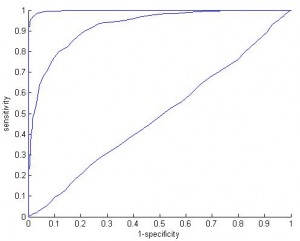
ROC (Receiver operating characteristic) is simply the plot of sensitivity against 1-specificity
AUC is the area under the ROC curve
ROC curve is close to the diagonal line if the two categories are mixed and difficult to classify; it will be high if the two categories are fully separated. Here I plot ROC curve in three simulated data with different overlaps between the two categories to be classified.
What’s the meaning of AUC? wiki says:
The AUC is equal to the probability that a classifier will rank a randomly chosen positive instance higher than a randomly chosen negative one.
This is hard to understand.
A single classifier won’t produce a curve; it only produces a single point (i.e. a single value of sensitivity and specificity). For example, we have 100 people and we want to know their gender based their heights and weights. If our classifier is “male if height larger than 1.7m”, then this classifier only produces a point.
A class of classifiers will produce a curve. Assume we have a class of classifier called “classify male/female based on height”. Then by changing the threshold we will achieve a curve (ROC).
Then there are many classes of classifiers. For example, we can have a class called “classify by weight”, or “classify by weight and height linearly”, or “classify by weight and height nonlinearly”, etc. It’s likely the ROC produced by class “classify by weight and height linearly” is higher than the ROC produced by “classify by height” and thus produces a larger value of AUC.
So AUC is a property of a class of classifier, not a single classifier. But what does it exactly mean? …


AUC is a measure of degree of discimination (for a binary variable) using a predictor or set of predictors.
It ranges from 0.5-1.0. But this is just one of the many conrcordance measures in Statistics.
If you have done data analyses before and performed a hypothesis test, say it was significant (i.e. reject null) does that mean that the null is not true?
@Statman
Thanks, Statman,
I think you can comfortably say that (null is not true).
hi,dr
I’m a student in master.
after I train AAN I want to compute accuracy,sensitivity,percision, specificity but with confusion matrix sensitivity and specificity have the same result.
can you help me to find a good code for compute performance of classifier.
thanks a lot.
hoda zamani
Dear Sir,
If I have two binary images, one is manually segmented and other is test result. In such case how to calculate those parameters.
Thanks
Code for sensitivity