I am learning svm lately and tried libsvm. It’s a good package.
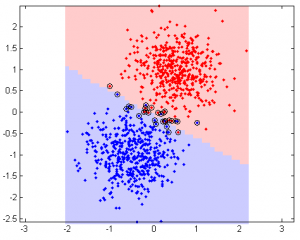
Linear kernel example (support vectors are in circles):
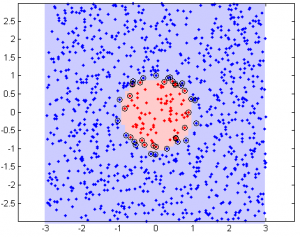
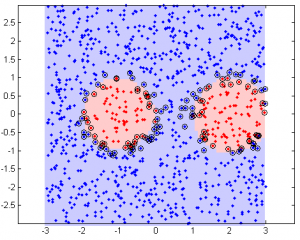
Nonlinear example (radial basis)
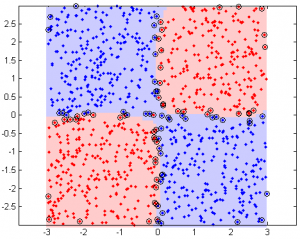
3-class example
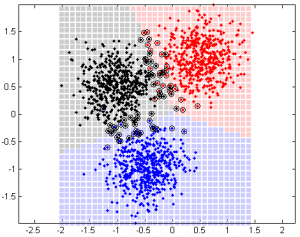
Basic procedure to use libsvm:
- Preprocess your data. This including normalization (make all values between 0 and 1) and transform non-numeric values to numeric. You can use the following code to normalize (from libsvm webpage):
(data - repmat(min(data,[],1),size(data,1),1))*spdiags(1./(max(data,[],1)-min(data,[],1))',0,size(data,2),size(data,2))
- Find optimal parameter values. For linear kernel, you have 1 parameter C (penalize parameter). For commonly used radial kernel, you have two parameters (C and gamma). Different parameter values will yield different accuracy rate. To avoid over fitting, you use n-fold cross validation. For example, a 5-fold cross validation is to use 4/5 of the data to train the svm model and the rest 1/5 to test. The option -c, -g, and -v controls parameter C, gamma and n-fold cross validation. A piece of code from libsvm website is:
bestcv = 0; for log2c = -1:3, for log2g = -4:1, cmd = ['-v 5 -c ', num2str(2^log2c), ' -g ', num2str(2^log2g)]; cv = svmtrain(heart_scale_label, heart_scale_inst, cmd); if (cv >= bestcv), bestcv = cv; bestc = 2^log2c; bestg = 2^log2g; end fprintf('%g %g %g (best c=%g, g=%g, rate=%g)\n', log2c, log2g, cv, bestc, bestg, bestcv); end end - You may have to run the above code several times with different range of parameter values to find the optimal values. For example, you might want to start from a bigger range with coarse resolution; then fine tune to smaller regions with higher resolution.
- After finding the optimal parameter values, use all data to train your model with your optimal parameter values.
cmd = ['-t 2 -c ', num2str(bestc), ' -g ', num2str(bestg)];
model = svmtrain(l, d, cmd);
- If you have new data, you may use this model to classify the new data.
[predicted_label, accuracy, decision_values] = svmpredict(zeros(size(dd,1),1), dd, model);
Commonly used options
- -v n: n-fold cross validation
- -t 0: linear kernel
- -t 2: radial basis (default)
- -s 0: SVC type = C-SVC
- -C: C parameter value, default 1
- -g: gamma parameter value
libsvm performance
I tested on different data size and record the time spent (in second).
Computer: Processor: 2×2.66G, memory: 12G, OS: Windows XP installed in VMWare in Mac OS 10.5
data size # features svmtrain svmpredict
100 2 0.00 0.00
100 6 0.00 0.00
100 10 0.00 0.00
100 20 0.00 0.00
100 50 0.01 0.00
100 100 0.02 0.01
500 2 0.02 0.01
500 6 0.03 0.02
500 10 0.05 0.03
500 20 0.08 0.03
500 50 0.46 0.07
500 100 0.56 0.12
1000 2 0.07 0.04
1000 6 0.10 0.06
1000 10 0.15 0.10
1000 20 0.36 0.14
1000 50 1.09 0.30
1000 100 3.07 0.50
It’s fairly fast.
Resources:
MatLab code to generate the plots above:cuixu_test_svm1
SVM basics: http://en.wikipedia.org/wiki/Support_vector_machine
Download libsvm for matlab at: http://www.csie.ntu.edu.tw/~cjlin/libsvm/#matlab
The meaning of libsvm output is at: http://www.csie.ntu.edu.tw/~cjlin/libsvm/faq.html#f804



Hi Xu Cui,
I am working also with LibSVM and I am very interested in your work 🙂
I have some questions and therefore it would be great if we can discuss it via e-mail.
Please write me your e-mail-address.
Many thanks in advance!
Best regards
Florian
Hi Xu Cui,
I am working with libsvm newely and I want to write a simple c++ program for one againts rest svm.I will be happy if you help me.
thanks,
erol
Is there a way to see the voting process for the one vs all implementation in LIBSVM?
Hi Xu Cui,
I have estimated SVM parameter thrugh some of the papers using model selection criteria, now I want to test my prediction model using cross-validation as it gives generalized error. will In svmtrain option if I give -v 5 my code shall work, kindly let me know. I’m using MATLAB version n quite poor in C++, so help me out
@PG
Yes, -v 5 should work.
Hi Xu Cui,
Your SVM plotting code for “Linear – 3 classes” only seems to plot a 2-dimensional vector. If I had a matrix of 3 or 4-dimensional vectors, how would the code be modified so that it can represent a +2-dimensional vector accurately in the output plot?
Maybe you could project your high dimensional data to 2D?
Dear Xu Cui,
I found the Matlab code for LIBSVM is very helpful. However, I would like to comment on one point you mentioned about the testing data. In your code, in the linear part, you claimed that half of the data is for training and the other half for testing. I can’t see that reflected in the published code. As a matter of fact the testing data you use is only coming from the use of “meshgrid” and it does not resemble half of the data.
If you have another version of the code then that will be very good.
Thanks
Raied
Dear Xu Cui,
I have a very interesting and weird question about SVM. When I use a different set (9 dimensions) of image and a reference image that doesn’t belong to it, the result of poly -SVM is giving %51 percent of accuracy.
How does this possible? Is taht mean I am doing smthg wrong or Lib-SVM is doing wrong.I can send the code if u want.
Thanks
@serra
I wonder why is it not possible to get 51%. Yes, code would be helpful.
BTW, what is poly-SVM?
@raied
Thank you for letting me know, raied.
thanks for your effort, but I get an error saying;
”??? Error using ==> svmtrain at 172
Group must be a vector.”
in the cv = svmtrain(l, d, cmd); line,
and when i want to drow SVs it draws only 2 circles in irrelevant places? what is wrong i didn’t understand?
I need help, tahnk you in advace
Regards,
dear Xu Cui
i have to use LibSvm for a multiclass classification so actually i’m using libsvm 3.0 for matlab. i want to know if the code above ( which generate the plots) support a multiclass classification?? if not how can i change it to support a multiclass classification
Thank you
yours
could you give me some example for libsvm matlab for classification and espicially regression?
i really need matlab mfile of regression using libsvm
thanks
check out here?
http://www.alivelearn.net/?p=1083
Hello there, You’ve done a fantastic job. I will definitely digg it and personally suggest to my friends. I am confident they’ll be benefited from this website.
Hi Xu Cui
I used your SVM code (RBF) for my data. I have two classes, coded 0.1 and 0.9
I scaled the data in a rank [0.1 0.9], 10 variables and 1368 observations
Accuracy of The train data is good. But the testing data (3080 observation) is 0% or very low
http://ifile.it/d0svzmt/Data.rar
I need you help to check.
Thanks
Hey, nice article. Was a great help. I want to use multi-class SVM (one-vs-rest approach). I have 6 labels and each label has 1000 feature. Can you please guide me in the right direction.
Thanks
Dear Xu Cui,
While I was searching for probability estimates for SVR as an output of
LIBSVM, I have seen your webpage. I would like to ask you if you know what
can be reason to have empty output evenif I active -b 1 in both svmtrain
and svmpredict functions? Evenif I created the data randomly, I do not
know why but the output is empty. Do you have any idea?
@Demir
Demir,
Unfortunately I am not sure what happened. I tested on my side and it works. Please note the last output variable of svmpredict is probability.
Hi Xu Cui and other users,
This is great. Thanks for sharing it. In the last few months has anyone developed any code for 2 class plots bigger than 2D?
Would be great.
Also has anyone worked out code for accuracy confidence intervals (such as by bootstrapping?)
Thanks,
Tom
i have 6 (labels: 1 2 3 4 5 6) classes and the data dimension is 262 i use libsvm to classify the data labels
first is this labeling is correct ?
how i can the classes result from svmpredict model
Dear Xu Cui
I want to use LIBSVM through MATLAB. I have a MS Visual C++ 2008 compiler.But the LIBSVM package is not opening in MATLAB. Please help.
I get an error saying;
”??? Error using ==> svmtrain at 172
Group must be a vector.”
in the cv = svmtrain(l, d, cmd); line,
what’s wrong? i’m trying to understand this svm code.
Regards,
Hi Xu,
I’m pretty new in Libsvm (Matlab interface) and SVM in general.I was able to write a little code but I’m not sure if it works correctly and I have some other questions, too. Is there a possibility to send an e-mail to you?
Thank you in advance
@amira
amira, please refer to the 3 class example
@Betty
Sure.
Where do I find your e-mail adress?
Hi,
I have a question regarding non linear SVM. does the LibSVM package provide the Support Vectors in the higher dimensional space or not? I need to know what is the coordinates of samples when transferred to higher dimension space by SVM.
Thank you
If I have only one data set how can I determine how much my model is good? Is “non sense” try to predict the model I’ve built on the same dataset that has been use for the training?
Hi Xu,
How to determine the values of the for loops :
for log2c = -1:3,
for log2g = -4:1,
Thank you
@Suresh Gorakala
Usually you need a few steps. First step you will try big ranges, e.g. -5:5, then after you find peak, narrow down the range with higher resolution around the peak, and repeat.
@Xu Cui
Could you please eloborate the above explanation.
Hi
I want to use libsvm with iris dataset witch have 4 features and 3 classes, I want to do 1 vs 1 and 1 vs all. I find W and b for each 2 class in 1 vs all but I cant plot the result, please help me ?!
HELP.
Dear Xu
I want to built an SVR for solar cell modeling where I want to predict the “voltage” in terms of “current” and “temperature”, namely, V=f(I,T). I have worked with neural networks and I know the meaning of training and testing. I used your provided code and faced with some problems. For example, suppose that x_train=[1 2;3 4;5 6] and y_train=[5;6;8] (target). how can I built a SVR model to predict the voltage for the point of x_test=[1.4 3]. please give me the matlab codes.
I will be very thankful in advance.
Ali
@Ali
Ali,
You can use svmpredict. First you use svmtrain to build the model, then you use svmpredict (model and new data as input parameters) to predict.
In the code http://www.alivelearn.net/wp-content/uploads/2009/10/cuixu_test_svm1.m you will find examples for both cases.
Hi Xu
I have some questions regarding svm and I need your help and expertise.
1) Based on the first image (linear shown above) which is obtained via training/testing data using libsvm, May I know what does the axes of the graph represent?
2) Is it alright to use a linear kernel for a two-class classfication that has a total of 69 features/dimensions?
As I am still new to svm, I am not sure if i am asking the right question. I apologise if I am not accurate or specific enough. I sincerely thank you for reading this comment and your help will be deeply appreciated.
Marcus
@Marcus Fwu
1) they are the two dimensions of the data.
2) It depends on the nature of your data. Usually when the # of features is big, non-linear kernel may overfit.
Hello Xu Cui, I need to make a classification of satellite images, I’m use LIBSVM in MATLAB, but I have 2 question:
1. How can i use a classification “1 vs 1” and “1 vs rest”? ¿what commands can i do use?
2. In my case I have got 3 classes, How can i use cross validation ?
I will be waiting for your answer, Thanks a lot, Regards
Hello Sir,
I have developed svm_model for regression, now i want to test it for a given input’x’. after reading the readme file i got that i should use
Function: double svm_predict(const struct svm_model *model,
const struct svm_node *x);
but i do not know how to use? please help so that i can use it in matlab.
thanks and regards
Vishal mishra
hello sir,
i am using libsvm for the classification of human actions. i have selected to actions and want to classify those actions so it is a binary classification.
i am facing the problem that libsvm shows 100% accuracy but the decision values are constant and hyperplane is not shown on graph
it gives me the warning.
Warning: Contour not rendered for constant ZData
please help me to continue my work
Thanks
How to scale both training and testing data in same manner?
hello
I would like to ask you what are the best svmtrain parameters for phoneme recognition
thank you for your reply
Hello XU Cui!
Can you please guide me how to create test and train files for libsvm use I have image data set, do not know how to divide it into test and train sets?
Hello Xu Cui,
I really dont have a question but I just wanna say thank you. you made a great explanation and very helpful. I couldnt find any perfect examples as yours
Hello Xu Cui,
I have two classes that have 300×200, 300 instances and 200 is the dimensionality of the feature. I hope you help me figure out how to represent this in a two linear class(decision boundary and # support vectors in each class.
Thank u
Dear Xu Cui,
I am very confused about one point. Until now I was always using test_label in SVMpredict command,where you have used zeros. Is it wrong what I am doing? I always get 0% accuracy, when used zeros or any double values.
I checked read_me file it also says if you dont have test labels you can use any double value. But when I use different values I get 0 % accuracy.
Thanks a lot.
Regards,
Thank you so much for this priceless information. I was wondering why do I get zero accuracy when I used the half of the training data in testing with zero labels as new data? I would be more than happy if you could kindly reply to my massage. Thank you
I just realized, I have asked the same question twice, I am really wondering why I get the same problem and is there a particular reason why it is happening:( thank you in advance.
Dear Xu Cui,
Can you please guide for inputting satellite images into matlab for libsvm usage
In my classification problem, I have 6 classes. When I use libsvm and use predict function, it will give 15 decision values for each input. From these values how can I decide predict label class?
Also, is these values representing the values of decision funtion?
Hello Xu Cui,
I have learned cross-validation to learn optimal values for c and gamma for radial basis function SVM using LIBSVM and the code available at LIBSVM site. But if i want to use the same code to obtain value of only C for a linear SVM it does not work.Some matrix dimension mismatch is the error message. Can you help in this regards. Tnx.
@serra
MATLAB has built in ‘svmtrain’ and ‘svmclassify’ functions… but here in this code Author has used the ‘svmtrain’ and ‘svmpredict’ functions from libsvm package available at https://www.csie.ntu.edu.tw/~cjlin/libsvm/ …
download them from there.. Hope it helps
@Xu Cui
How to determine the values of the for loops :
for log2c = -1:3,
for log2g = -4:1,
How to know the optimum range for the value of c and g?
when i tried with different range i get different accuracy and different cross validation accuracy.(low cross validation like 52.4 )but accuracy 90 and sometime even 100% . how to know whether i have overfitting in my data?
thanks in advance
Hello
your code is really helpful.
Just a question, do you know how to draw a line as a decision boundary among the support vectors?
Regards
Amin
Please, I need your help. How can I construct an routines in Octave, to give k random groups automatically? For example, I have n = 161, k = 5 and I want to construct an routines to give 5 random group.
Jailson Lopes
Dear Xu Cui,I am using epsilon SVR to my research problem. I scaled the input and output both the variable in between 0 to 1. Now i wanted to use grid search optimization technique to get the optimized value of cost (c), radial basis(gamma) and the margin(epsilon)parameter. Literature suggested that, the search range for C is in between 0 to 32768. Could you please suggest me for the scaled dependent data also, this range will works. Whether C is any dependency over the range of dependent variable or not. Or i should change the search space from 0 to 3 for the scaled dependent data.