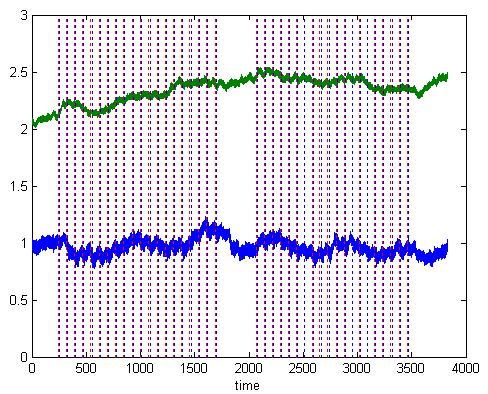
Can you find any pattern in the two signals, green and blue?

The blue signal is the brain wave (measured by NIRS) of a person when he is pressing some buttons (the timing of button pressing is shown in the vertical lines); the green signal is also brain wave but from a second person who is doing the same thing (button pressing). With naked eyes, it’s hard to see if there is any pattern in the signals in relation with each other, or with the button pressing. But wavelet coherence analysis tell you something.

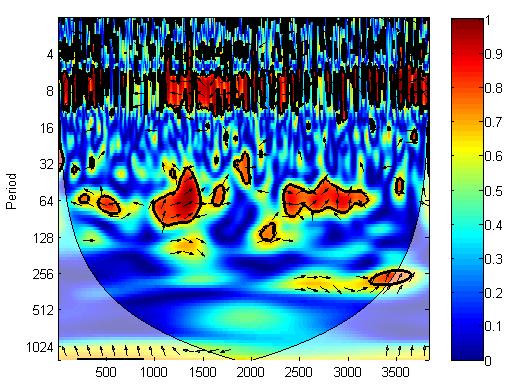
In the above figure, I plot the wavelet coherence between the two signals in both time and frequency domain. Coherence is kind of correlation. 1 (red) means the two signals are highly correlated and 0 (blue) means no correlation. There are definitely something interesting between the two signals.
First, there is a red band in the period 8 region. As the sampling frequency of the signals is 10Hz, period 8 means 0.8s. This band is originated from heart beating (~1Hz) and indicates that the two people’s heart beating is highly correlated.
Second, there are some red blobs in the period 64 region. The button pressing is occurring at 6-7s frequency. These blobs indicate that the two people’s brain are correlated during button pressing.
So, with wavelet coherence analysis, you can discover something you might not discover with other methods.
Cross Wavelet and Wavelet Coherence Toolbox Note: this link is dead. To download the “Cross Wavelet and Wavelet Coherence Toolbox”, please enter
https://www.alivelearn.net/?p=1561
Other blog posts on wavelet analysis
PS: You may wonder why the two brain signals are correlated. In fact, the two people are doing a cooperative task. They have to press buttons at the same time to win a point. We at the same time measure their brain activity and find their brain is correlated during cooperation (but not during competition).
Check out our publication: Cui et al, NIRS-based hyperscanning reveals increased interpersonal coherence in superior frontal cortex during cooperation, NeuroImage, 2012
[update 2017-01-25] We contributed to MatLab (wavelet toolbox) https://www.alivelearn.net/?p=1957


Dear Dr. Xu:
Could you please tell me what tools you usually apply when you analyze the data from NIRS? I always get signals from which the pattern are usually hard to detect with bare eye. Also, when you consider the changes in signal, did you take the scattering coefficient changes into consideration?
Hope to see your reply.
Thanks!
@Zoe
I usually write my own programs to analyze data. I used nirs-spm for a while and you may check it out.
We do use scattering coefficient to calculate the change of hbo and hbr.
Dear Dr. Xu:
Thank you, I will check the SPM.
Does that mean that you calculate the scattering coefficient in real time, and apply the real time optical property to calculate the HbO and Hbr level?
And how do you usually consider the brain structure, do you consider it as several layers or you treat it as a homogeneous tissue?
Thanks for your time!
Best Regards
@Zoe
It’s called NIRS-SPM.
No. For we calculate after we acquired the data. For real time experiment, the device we use (ETG4000) calculated the hbo hbr level automatically.
We did not consider the structure of brain in the calculation.
Hi Dr Xu
could you explain the difference between a crosswavelet and a wavelet coherence?
Thanks
@Guillermo
I feel like wavelet coherence (value from 0 to 1) is normalized crosswavelet (value can be complex).
Can we classify normal ECG and abnormal ECG using wavelet coherence and cross correlation.
Hi, Dr Cui
What is coherence mean? I know it is a character of waves, which have the same frequency. But, when it comes to two persons, what’s that mean? And what could it tell us?
@Ning
Hi, Lili,
Coherence is “correlation” between two signals at a certain frequency, also accounting for lags. I have a few posts on wavelet coherence and they may help:
http://www.alivelearn.net/?s=wavelet
Xu
Thank you for your reply. And there is another question, how to choose the frequency band?Is that depends on RT?@Xu Cui
Dear Dr. Xu
My research is related to “Spatiotemporal groundwater level modeling using hybrid artificial intelligence-meshless method”
i like to know what is the correlation between input time series data (rainfall, runoff and grounwater level lag time series) and output time series data (groundwater level).
ANN input and output prediction:
R(t-1) , R2(t-1), GL (t-1) —> Gl (t)
What can use wavelet coherence?
Dear Sir,
can you please guide me how I can cut the cone of influence in WTC diagram and how I can limit my frequency scale upto 256
@Naveed Raza
To cut, you may use photoshop? I never did that.
As to limit your frequency, you may use ‘ms’ argument. Please refer to:
http://www.alivelearn.net/?p=1518
Dear Dr. Xu,
I wonder if you could share a small sample as .CVS file from one of your experiments. The reason I am asking for this is that the data I am using appears to have a different result when I plot the wavelet coherence. So I do not know if my database is wrong or not.
I did an anti-correlation check between Hbo and Hbr and it appears to be OK with only 3 or 4 bad channels.
I can share/email my figures if it is needed.
Thanks for your help.
@Zapata
Check out
http://www.alivelearn.net/?p=1832
Dear Dr. Cui,
As you said, there are some red blobs in the period 64 region (i.e., about 6.4s). The button pressing is occurring at 6-7s frequency. These blobs indicate that the two people’s brain are correlated during button pressing.
Since your task lasted about only 6 min, the peak MaxScale reached 1024 region. I used the same wtc method to analyze the data lasting 40 min (task:a long two-person talk),however the peak MaxScale reached 8192 region. My question is, whether the horizontal coordinate (i.e., Time) covaried with the vertical coordinate (i.e., Period)?
Closely related, the inter-brain coherence in my 40-min talk mainly appears in the 256-1024 period. It is weird to focus such high period based on your rationale provided (i.e., 64period corresponds 6~7s button-pressing). Simply because I have not see such high period in existing fNIRS hyperscanning studies.
I look forward to hearing you!
Yafeng Pan
Dear Dr. Xu
感谢您分享的程序和使用心得体会。交叉小波和小波相干图谱里面的箭头有特定的含义,右箭头表示正相关,左箭头表示负相关,这个还能理解。但是上下箭头表示相位角提前或滞后90°,这是什么概念,具体表示什么含义呢,还请Dr. Xu帮忙解释一下.
Thank you!
@Hu Sheng
可以参考:http://www.alivelearn.net/?p=1169
您好,我在理解matlab生成的wavelet coherence图的时候发生了困难,找到了您的博客。
我有若干疑问,还请不吝赐教:
1.我很困惑的是生成了这样一个wavelet scale – frequency/period的矩阵,如何才能把它压缩成一个scalar来形容这两个timeseries的整体的相关性?就像相关系数那样?
2.我有同一个人两个不同脑部ROI的fMRI的timeseries, 有80个timepoints, TR=720ms。那么对应timescale-period图中的某一个点,例如, 在time40秒处period20秒处的取值是0.999,表达了什么含义呢?是从0~40秒的范围内,20秒一个cycle的时间内,相关度很高的意思吗?
@Xiang Xiao
1. 可以把这个矩阵的数值平均成一个值。参考:http://www.alivelearn.net/?p=1518
2. 说明在time 40s附近,这两个信号在1/20频率上有很高的相关度。
@Xu Cui
感谢回答!我也看了您哪一篇,您的意思是先过滤一部分必定相关的(例如period > 32 )然后再直接求平均吗?这样会不会损失了比较多的情报。
另外再追问一下,https://cn.mathworks.com/help/wavelet/ref/wcoherence.html matlab2016b自带了Wavelet coherence的模块,但是计算Wavelet coherence矩阵的时候可以设置两个参数,一个是period,一个是frequency,也可以都不设置。例如我上面问您的那个例子里的fMRI的时间序列,应该怎么样设置period和frequency呢?比如frequecny是不是就是TR=720ms的倒数设置为1/0.72而period(interval)就设置为seconds(0.72),还是说不用设置?
问题有些拙劣,百忙之中烦请赐教。
@Xiang Xiao
对相关的频率求平均是比较合理的做法,因为有可能其他频率的是噪音,这样如果整体平均的话信号反而被淹没了。
matlab自带的wavelet coherence这个,我还不熟悉,因此不敢乱给建议。
btw,matlab的wavelet package中用到的nirs数据是我们的数据:https://www.mathworks.com/help/wavelet/examples/compare-time-frequency-content-in-signals-with-wavelet-coherence.html
Please check out: http://www.alivelearn.net/?p=1957
我想请问,wavelet coherence中关于significance level的计算问题,您论文中的significance level的计算方法跟A Grinsted工具箱中的一样吗?
@Yibo Wang
不一样。我们论文的significance是多个被试t-test出来的,工具中是针对单个被试模拟出来的。
非常感谢您的回答,我想问一个问题,当有多个试次时,如何计算这些试次的平均wavelet coherence?
@Yibo Wang
This post might be helpful:
http://www.alivelearn.net/?p=1518
Dear Cui,
Thank you for the complete explanation for the wavelet analysis. I am currently conducting an analysis using this method. You mention that coherency in wavelet representing the correlation between two (time-series) dataset. However, is there anyway to understand if the data were negatively or positively correlated?
The arrow direction indicate the phase difference.
Please refer to: https://alivelearn.net/?p=1169
Hi, I am making a wavelet coherence plot on the MatLab 2021 version. sir I want to know about sampling interval theory and how can we set the optimum sampling interval according to any given data and I am unable to change my y-axis values in the MatLab 2021 wavelet coherence plot.
Shafqat, unfortunately I do not know sampling interval theory …